Quantifying mitochondrial networks in 3D

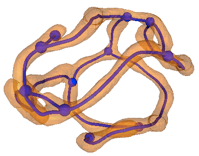

edges
tubules

nodes
branch-points and end-points
‘Mitograph’
(mitochondrial network graph)
The total length of the Mitograph represents the physical size of the network while its topology can be analyzed using standard concepts and methods from network analysis.
This method opens the field to rigorous quantitative analysis and thus, computational modeling, of mitochondrial network morphology. We are extending and improving this approach to obtain more accurate Mitographs, to automatically detect fission and fusion dynamics, and to apply it more generally to other 3D biological tubular structures.
Mitograph methodology
We have developed a novel computational method to automatically and consistently measure the physical size and topology of mitochondrial networks in budding yeast in collaboration with Luciano da Fontoura Costa (Cybernetic Vision Group, University of Sao Paolo, Brazil).
A crucial missing element in studying mitochondrial morphology is the ability to identify and quantify subtle effects. Gross changes to mitochondrial networks that abolish tubular structure or that generate distinct topologies, such as over-fragmented networks, have been identified by eye. Subtle changes, nevertheless, significantly modify cell functions and contribute to the cellular basis of disease.